
Nearly 36 million Americans live in poverty in the United States, according to the latest data from the U.S. Census Bureau. These individuals struggle with food insecurity, access to quality education, housing, health care and more. While each state has taken action to reduce poverty, some states support their impoverished residents much more than others.
To highlight the best states for people in poverty and the ones that need to improve the most, SmileHub compared each of the 50 states based on 20 key metrics. The data set ranges from the food insecurity rate to the number of charities for reducing poverty per capita to income inequality.
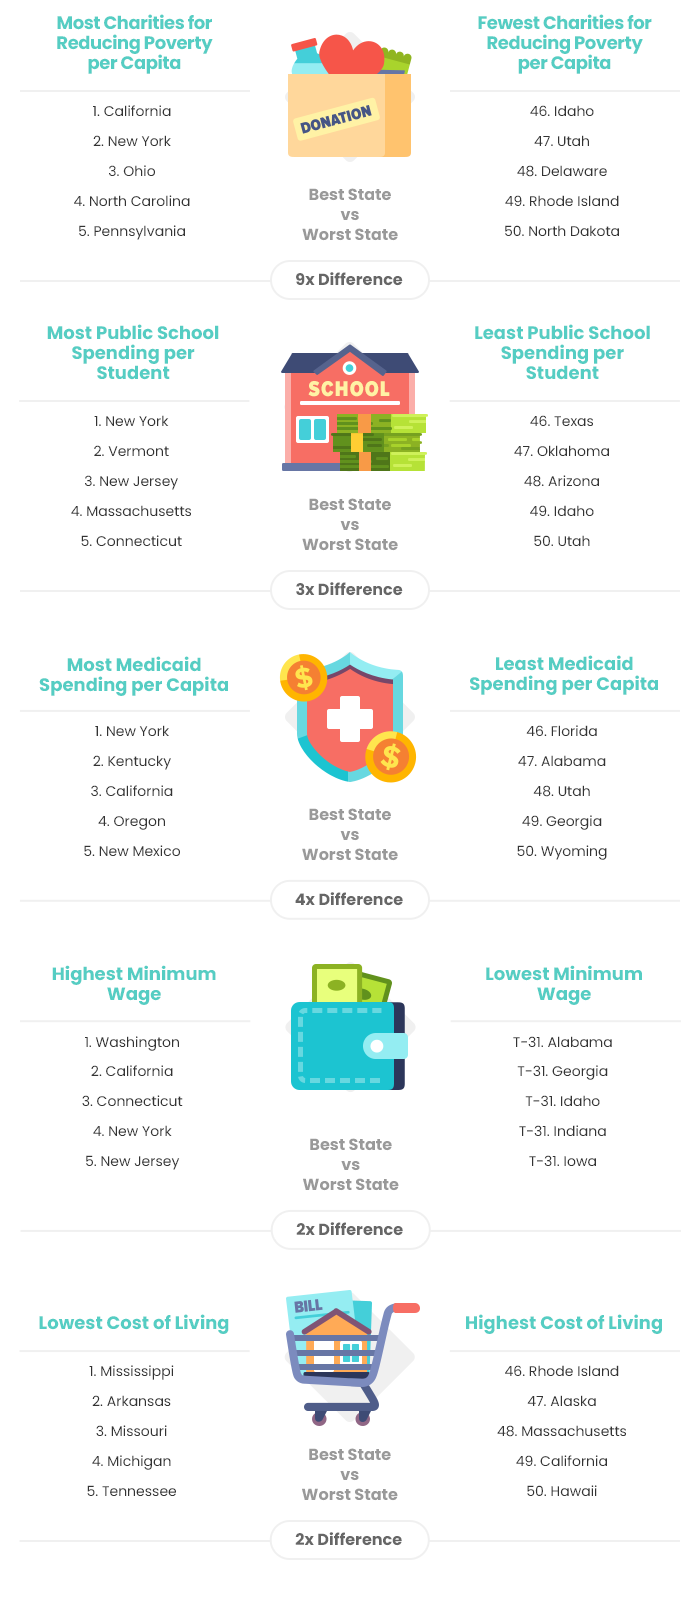
If you want to support people in poverty but don’t know where to donate, check out our picks for the Best Charities for Reducing Poverty in 2026.
Main Findings
Best States for People in Poverty
| Overall Rank* | State | Total Score | Education & Transportation Availability Rank | Income & Benefits Rank | Housing, Healthcare & Food Rank |
| 1 | Massachusetts | 68.28 | 2 | 8 | 5 |
| 2 | Minnesota | 65.62 | 11 | 4 | 1 |
| 3 | Washington | 64.43 | 9 | 1 | 18 |
| 4 | New Jersey | 63.77 | 3 | 10 | 17 |
| 5 | Maryland | 63.62 | 6 | 5 | 11 |
| 6 | Rhode Island | 63.13 | 12 | 6 | 4 |
| 7 | New York | 60.39 | 1 | 24 | 26 |
| 8 | Illinois | 59.17 | 4 | 17 | 20 |
| 9 | Colorado | 58.72 | 17 | 2 | 30 |
| 10 | California | 58.64 | 7 | 9 | 32 |
| 11 | Maine | 58.54 | 25 | 11 | 6 |
| 12 | Vermont | 58.25 | 18 | 12 | 10 |
| 13 | New Hampshire | 57.72 | 28 | 13 | 2 |
| 14 | Oregon | 57.50 | 10 | 7 | 34 |
| 15 | Connecticut | 57.42 | 5 | 16 | 19 |
| 16 | Michigan | 55.39 | 8 | 19 | 25 |
| 17 | Alaska | 54.17 | 40 | 3 | 35 |
| 18 | Delaware | 54.02 | 16 | 15 | 22 |
| 19 | Missouri | 51.81 | 22 | 21 | 23 |
| 20 | Virginia | 51.79 | 20 | 27 | 13 |
| 21 | Iowa | 51.76 | 29 | 29 | 8 |
| 22 | Pennsylvania | 51.22 | 19 | 35 | 7 |
| 23 | Hawaii | 50.26 | 21 | 23 | 28 |
| 24 | North Dakota | 49.59 | 45 | 31 | 3 |
| 25 | South Dakota | 49.22 | 46 | 26 | 8 |
| 26 | Ohio | 48.49 | 34 | 33 | 12 |
| 27 | Indiana | 48.48 | 33 | 32 | 14 |
| 28 | Arizona | 48.21 | 41 | 14 | 33 |
| 29 | New Mexico | 48.06 | 13 | 37 | 24 |
| 30 | Nevada | 46.83 | 15 | 22 | 44 |
| 31 | Wisconsin | 45.36 | 36 | 20 | 40 |
| 32 | North Carolina | 45.33 | 24 | 41 | 16 |
| 33 | Montana | 44.93 | 43 | 36 | 21 |
| 34 | Nebraska | 44.21 | 42 | 25 | 37 |
| 35 | Idaho | 42.71 | 50 | 30 | 29 |
| 35 | Utah | 42.71 | 48 | 18 | 42 |
| 37 | Kentucky | 42.16 | 30 | 47 | 15 |
| 38 | Tennessee | 42.09 | 14 | 40 | 39 |
| 39 | Kansas | 41.58 | 27 | 38 | 41 |
| 40 | Wyoming | 40.85 | 23 | 28 | 49 |
| 41 | West Virginia | 40.09 | 35 | 45 | 27 |
| 42 | Oklahoma | 39.02 | 31 | 42 | 38 |
| 43 | Florida | 37.13 | 39 | 34 | 48 |
| 44 | Louisiana | 36.07 | 26 | 49 | 31 |
| 45 | Arkansas | 36.00 | 37 | 44 | 45 |
| 46 | Alabama | 34.52 | 47 | 48 | 36 |
| 47 | South Carolina | 33.90 | 38 | 46 | 46 |
| 48 | Georgia | 33.68 | 44 | 43 | 47 |
| 49 | Texas | 32.05 | 32 | 39 | 50 |
| 50 | Mississippi | 28.44 | 49 | 50 | 43 |
Notes: *1 = Best
With the exception of “Total Score,” all of the columns in the table above depict the relative rank of that state, where a rank of 1 represents the best conditions for that metric category.
Methodology
In order to determine the best states for people in poverty, SmileHub compared the 50 states across three key dimensions: 1) Education & Transportation Availability, 2) Income & Benefits and 3) Housing, Healthcare & Food.
We evaluated those dimensions using 20 relevant metrics, which are listed below with their corresponding weights. Each metric was graded on a 100-point scale, with a score of 100 representing the highest level of poverty support. For metrics marked with an asterisk (*), the square root of the population was used to calculate the population size in order to avoid overcompensating for population differences across states.
We then determined each state's weighted average across all metrics to calculate its overall score and used the resulting scores to rank-order the states.
Education & Transportation Availability - Total Points: 20
- Access to Public Transportation: Full Weight (~5.00 Points)
Note: This metric measures the share of commuters who use public transit. - Public Schools per Capita*: Full Weight (~5.00 Points)
- Public School Spending per Student: Full Weight (~5.00 Points)
- Presence of a Free Community College Education: Full Weight (~5.00 Points)
Note: This metric considers the presence or absence of legislation to provide free community-college education or if such legislation is currently under consideration.
1 - Statewide free college tuition program enacted with few eligibility limits;
0.5 - State-sponsored free college tuition programs with income, merit, geographical or programmatic limitations;
0 - This state does not have a statewide free college tuition program that meets Campaign for Free College Tuition's recognition criteria.
Income & Benefits - Total Points: 40
- Charities for Reducing Poverty per Capita*: Full Weight (~3.33 Points)
- Share of Residents Living in Poverty: Triple Weight (~10.00 Points)
- Public Welfare Expenditure per Capita: Full Weight (~3.33 Points)
- Minimum Wage: Full Weight (~3.33 Points)
- Individual Income Tax as a Share of Personal Income: Full Weight (~3.33 Points)
- Income Inequality: Triple Weight (~10.00 Points)
Note: This metric is based on the GINI index, which measures the extent to which the distribution of income or consumption among individuals or households within an economy deviates from a perfectly equal distribution. A Gini index of 0 represents perfect equality, while an index of 100 implies perfect inequality. - Presence of Mandatory Paid Sick Leave: Full Weight (~3.33 Points)
Note: This is a binary metric:
1 - This state has a mandatory paid sick leave law;
0 - This state does not have mandatory paid sick leave laws. - Presence of Paid Family Leave: Full Weight (~3.33 Points)
Note: This is a binary metric:
1 - This state has paid family leave;
0.5 - This state has enacted paid family leave;
0 - This state does not have paid family leave.
Housing, Healthcare & Food - Total Points: 40
- Food Insecurity Rate: Triple Weight (~12.00 Points)
Note: Food insecurity rate measures the percentage of households that qualified as low food security or very low food security, based on survey responses to the U.S. Department of Agriculture’s annual Food Security Supplement to the monthly Current Population Survey. Households that affirm three out of the ten survey questions (eighteen for households with children) are classified as food insecure. Adult-only households that affirm 6 items, and households with children that affirm 8 items, are classified as very low food secure. - Average Benchmark Premiums for Health Insurance: Full Weight (~4.00 Points)
Note: Premiums were analyzed using the second-lowest cost silver (benchmark) premium for a 40-year-old in each county and weighted by county plan selections, including premiums for non-Essential Health Benefits. - Presence of an Expanded Medicaid Policy: Full Weight (~4.00 Points)
Note: In a state with an expanded Medicaid policy, income alone is enough to qualify for Medicaid. In states without an expanded policy, multiple factors, including income, disability status, and household size must be considered, and the total list of requirements can vary by state.
This is a binary metric:
1 - This state has implemented an expanded Medicaid policy;
0 - This state has not implemented an expanded Medicaid policy. - Medicaid Spending per Capita: Full Weight (~4.00 Points)
- Cost of Living: Full Weight (~4.00 Points)
Note: This metric is based on The Council for Community and Economic Research's 2024 annual Cost of Living Index. - Median Monthly Rent: Full Weight (~4.00 Points)
- Affordable and Available Rental Homes per 100 Extremely Low-Income Households: Full Weight (~4.00 Points)
Note: Renters with extremely low incomes refers to households where the income is at or below either the federal poverty guideline or 30% of their area median income, whichever is greater. - Federal Rental Assistance per Capita: Full Weight (~4.00 Points)
Sources: Data used to create this ranking were collected from the U.S. Census Bureau, Internal Revenue Service, U.S. Department of Agriculture, National Center for Education Statistics, National Education Association, Campaign for Free College Tuition, Urban Institute, National Council of State Legislatures, National Partnership for Women and Families, Medicaid.gov, Kaiser Family Foundation, Council for Community and Economic Research, National Low Income Housing Coalition and Center on Budget and Policy Priorities.
Was this article helpful?
Disclaimer: Editorial and user-generated content is not provided or commissioned by charities. Opinions expressed here are the author’s alone and have not been approved or otherwise endorsed by any charity. Our content is intended for informational purposes only, and we encourage everyone to respect our content guidelines. Please keep in mind that it is not a charity’s responsibility to ensure all posts and questions are answered.