
The U.S. is home to over 21,000 native species of plants and animals, with over 1,300 of them listed as either endangered or threatened. This wildlife relies on diverse ecosystems that are increasingly under threat. There are also more than 6,500 invasive species across the country competing with native wildlife and disrupting their natural habitats. Combined with challenges like land development, pollution, and climate change, these pressures make effective conservation efforts essential.
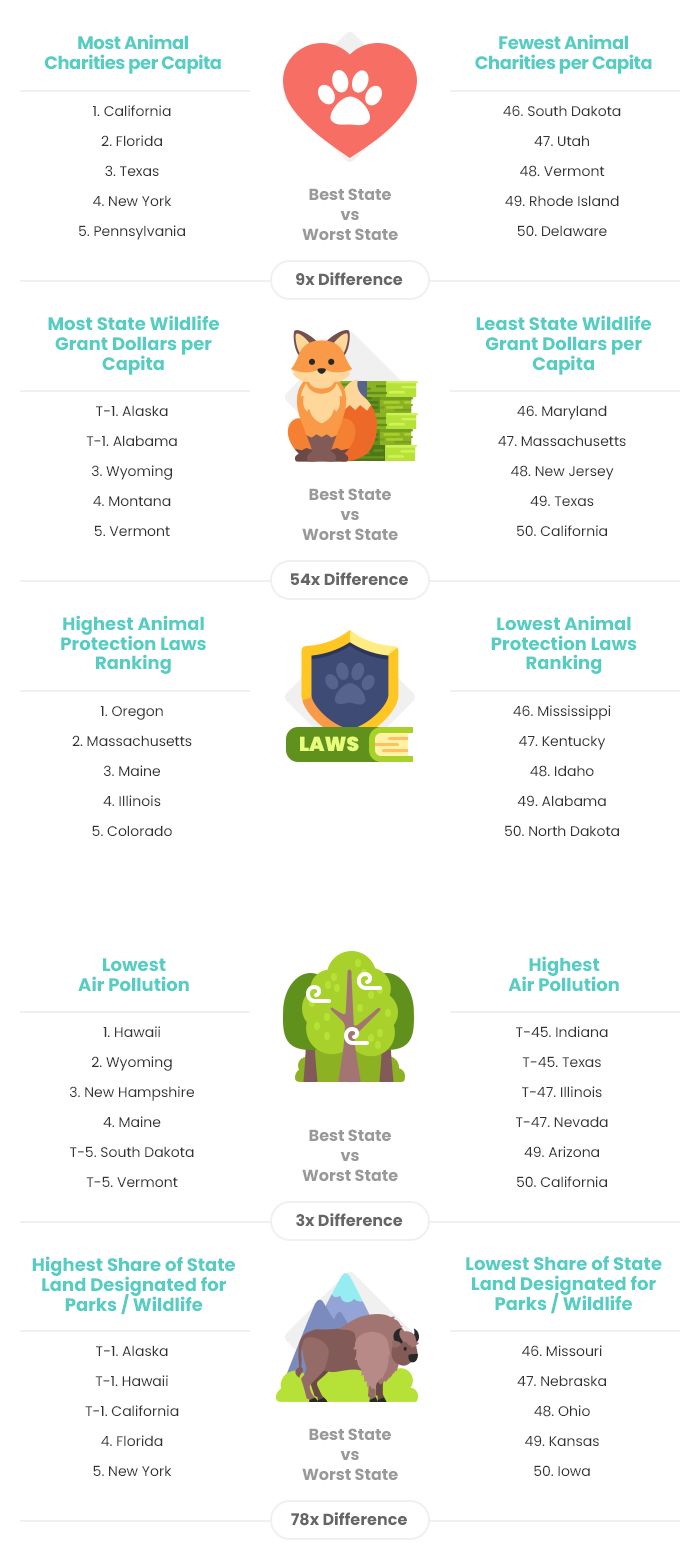
To highlight the best states for wildlife protection and the ones that have the most room to improve, SmileHub compared each of the 50 states using 17 key metrics. The data set ranges from the number of animal charities per capita to the amount of state wildlife grant money per capita to the overexploitation of wild species.
You can find the results below. In addition, if you want to support wildlife protection but don’t know where to donate, you can check out our picks for the Best Charities for Animals in 2026.
Main Findings
Best States for Wildlife Protection
| Overall Rank* | State | Total Score | Government & Community Support Rank | Legal Protection Rank | Ecosystem Status Rank |
| 1 | Vermont | 63.30 | 7 | 5 | 5 |
| 2 | Wyoming | 61.19 | 3 | 19 | 2 |
| 3 | Oregon | 60.44 | 5 | 9 | 13 |
| 4 | Colorado | 60.02 | 13 | 3 | 21 |
| 5 | California | 59.57 | 8 | 1 | 38 |
| 6 | Alaska | 58.94 | 1 | 25 | 15 |
| 7 | Maine | 57.62 | 15 | 15 | 1 |
| 8 | New Hampshire | 56.98 | 27 | 8 | 4 |
| 9 | Washington | 53.85 | 12 | 7 | 25 |
| 10 | Montana | 51.78 | 2 | 44 | 10 |
| 11 | Minnesota | 51.03 | 18 | 17 | 7 |
| 12 | Florida | 49.19 | 19 | 2 | 50 |
| 13 | Nebraska | 48.03 | 33 | 21 | 3 |
| 14 | Pennsylvania | 46.88 | 17 | 10 | 34 |
| 15 | New York | 46.88 | 14 | 18 | 23 |
| 16 | Massachusetts | 46.75 | 44 | 6 | 32 |
| 17 | Illinois | 45.66 | 41 | 11 | 24 |
| 18 | Hawaii | 45.59 | 10 | 20 | 20 |
| 19 | Virginia | 45.51 | 22 | 14 | 29 |
| 20 | Rhode Island | 45.12 | 30 | 13 | 26 |
| 21 | Iowa | 44.16 | 24 | 32 | 8 |
| 22 | New Jersey | 44.09 | 35 | 4 | 47 |
| 23 | Idaho | 41.34 | 9 | 41 | 14 |
| 24 | Maryland | 41.16 | 25 | 16 | 43 |
| 25 | West Virginia | 40.10 | 32 | 30 | 18 |
| 26 | Louisiana | 39.83 | 26 | 12 | 48 |
| 27 | North Dakota | 39.63 | 11 | 47 | 9 |
| 28 | South Dakota | 39.47 | 6 | 50 | 6 |
| 29 | New Mexico | 38.55 | 21 | 29 | 31 |
| 30 | Wisconsin | 38.48 | 23 | 35 | 17 |
| 31 | Texas | 38.23 | 16 | 28 | 40 |
| 32 | Alabama | 37.91 | 4 | 48 | 33 |
| 33 | Oklahoma | 37.01 | 34 | 37 | 12 |
| 34 | Missouri | 36.13 | 38 | 42 | 11 |
| 35 | Michigan | 35.95 | 42 | 27 | 30 |
| 36 | Kentucky | 35.81 | 47 | 33 | 19 |
| 37 | Connecticut | 35.65 | 50 | 22 | 36 |
| 38 | Indiana | 33.93 | 48 | 24 | 41 |
| 39 | Utah | 33.56 | 29 | 26 | 46 |
| 40 | Arkansas | 33.37 | 40 | 40 | 22 |
| 41 | Delaware | 33.00 | 28 | 23 | 49 |
| 42 | Tennessee | 31.75 | 46 | 31 | 39 |
| 43 | South Carolina | 31.46 | 31 | 43 | 27 |
| 44 | North Carolina | 31.45 | 39 | 36 | 35 |
| 45 | Arizona | 30.10 | 45 | 34 | 44 |
| 46 | Georgia | 29.63 | 36 | 45 | 28 |
| 47 | Ohio | 29.26 | 20 | 46 | 42 |
| 48 | Kansas | 29.12 | 43 | 49 | 16 |
| 49 | Mississippi | 28.59 | 49 | 39 | 37 |
| 50 | Nevada | 28.33 | 37 | 38 | 45 |
Note: 1* = Best
With the exception of “Total Score,” all of the columns in the table above depict the relative rank of that state, where a rank of 1 represents the best conditions for that metric category.
Methodology
In order to determine the best states for wildlife protection, SmileHub compared the 50 states across three key dimensions: 1) Government & Community Support, 2) Legal Protection and 3) Ecosystem Status.
We evaluated those dimensions using 17 relevant metrics, which are listed below with their corresponding weights. Each metric was graded on a 100-point scale, with a score of 100 representing the highest level of wildlife protection. For metrics marked with an asterisk (*), the square root of the population was used to calculate the population size in order to avoid overcompensating for population differences across states.
We determined each state’s weighted average across all metrics to calculate its overall score and used the resulting scores to rank-order the states.
Government & Community Support - Total Points: 35
- Animal Charities Per Capita*: Full Weight (~5.00 Points)
- Environmental Protection Charities Per Capita*: Full Weight (~5.00 Points)
- Number of State Conservation Programs and Initiatives: Full Weight (~5.00 Points)
Note: This metric refers to the number of conservation programs listed for each state by the U.S. Department of Agriculture’s Natural Resources Conservation Service that directly or indirectly help the animals in each state.
- State Wildlife Grants per Capita: Double Weight (~10.00 Points)
Note: Established in 2000, State Wildlife Grants provide money to states, territories, commonwealths, and D.C. to address wildlife conservation needs such as research, surveys and species and habitat management. Projects focus on wildlife species of greatest conservation need identified in State Wildlife Action Plans.
- Number of Education and Outreach Programs for Wildlife Conservation: Full Weight (~5.00 Points)
- Zoologists & Wildlife Biologists per Capita: Full Weight (~5.00 Points)
Legal Protection - Total Points: 35
- Animal Protection Laws Ranking: Double Weight (~11.67 Points)
Note: This metric is based on the Animal Legal Defense Fund’s “Best & Worst States for Animal Protection Laws” ranking.
- Share of State Land Designated for Parks and Wildlife: Full Weight (~5.83 Points)
- Presence of Wildlife Corridor Legislation: Full Weight (~5.83 Points)
Note: Wildlife corridors connect dynamic landscapes between ecologically sound habitat areas. They support the flow of wildlife and the natural processes upon which they rely. Corridors contribute to the resilience of a land- or seascape by allowing species to adapt and complete their life cycles with the resources they require for survival. However, increasing habitat fragmentation, and anticipated shifts in the climate have put these essential movements at risk.This is a binary metric:
- 1 - Legislation Enacted;
- 0.5 - Legislation Introduced / Executive Order Issued;
- 0 - No Legislation (not labeled on map, since it’s just states not marked with anything in the legend).
- 1 - Legislation Enacted;
- Presence of Endangered Species Legislation: Full Weight (~5.83 Points)
- State Internet-Hunting Laws: Full Weight (~5.83 Points)
Note: As of 2024, about 42 states have laws or regulations banning remote control and/or computer-assisted hunting of animals. Some states like Arkansas, Florida, Oregon, and Missouri implement this ban through administrative regulation. Some laws are more specific than others and ban not only the owning and operating of a shooting range for the purpose of online shooting, but also ban creating such websites. In some states, people may also be fined or given jail time for utilizing a website via the Internet which allows the online shooting of animals.
Ecosystem Status - Total Points: 30
- Vulnerability to Climate Change: Full Weight (~5.00 Points)
Note: This metric is determined by taking the average number of days of climate shift index values of 3 or higher, based on Climate Central data from June 2024 through August 2024. The greater the number of days, the more vulnerable to climate change we consider the state.
- Industrial Toxins per Square Mile of Land Area: Full Weight (~5.00 Points)
- Median Air Quality Index: Full Weight (~5.00 Points)
Note: This metric measures the average exposure of the general public to particulate matter of 2.5 microns (PM2.5) or less in size. Per the Environmental Protection Agency, atmospheric deposition of nitrogen and sulfur resulting from air pollution is a major stressor to natural ecosystems, often leading to acidification and eutrophication of both terrestrial and aquatic ecosystems.
- “Invasive Species” Threat Ranking: Full Weight (~5.00 Points)
Note: Invasive species, non-native animals or plants introduced to a new environment, can cause ecological damage, and outcompete native species for key resources (e.g., space, food, etc.). Globally, two hundred new invasive species are recorded every year, associated with increases in trade and human population. In the history of the U.S., more than 50,000 invasive species have been introduced. These introductions come with a cost: invasive species management and damages are estimated at $20 billion each year. Nearly 40% of the invasive plants now in the U.S. were originally introduced as ornamentals, and these species affect nearly every ecosystem of the country and continue to expand into new areas. Invasions are predicted to increase another 40% by 2050. At least half of the species listed as threatened or endangered in the U.S. are threatened by invasive species. Some invasive species may pose a greater threat to wildlife and habitats than others.
- “Land-Use Change” Threat Ranking: Full Weight (~5.00 Points)
Note: Land- and sea-use changes lead to the loss and degradation of natural habitats. Conversion of natural habitat to human-dominated land uses such as residential or agricultural areas can fragment habitats, isolate species, reduce the number of species, and more. Previous research points to habitat loss as the most prevalent cause of species endangerment in the U.S. It is a main reason for listing over 1,250 species as threatened or endangered under the Endangered Species Act.
- “Overexploitation” Threat Ranking: Full Weight (~5.00 Points)
Note: Overexploitation removes species from the wild at rates faster than they can recover. To feed and fuel our 21st-century lifestyles, the U.S. is using over twice the renewable natural resources and services that can be regenerated within its borders. Although our population is 60% larger than it was in 1970, consumer spending has increased 400%. Overexploitation poses a threat to at least 26% of species listed under the Endangered Species Act.
Sources: Data used to create this ranking were collected from the U.S. Census Bureau, Bureau of Labor Statistics, Environmental Protection Agency, U.S. Department of Agriculture, U.S. Fish & Wildlife Service, Internal Revenue Service, Conservation Corridor, National Caucus of Environmental Legislators, Michigan State University College of Law, Climate Central, America’s Health Rankings, Animal Legal Defense Fund and Defenders of Wildlife.
Was this article helpful?
Disclaimer: Editorial and user-generated content is not provided or commissioned by charities. Opinions expressed here are the author’s alone and have not been approved or otherwise endorsed by any charity. Our content is intended for informational purposes only, and we encourage everyone to respect our content guidelines. Please keep in mind that it is not a charity’s responsibility to ensure all posts and questions are answered.